Learn to read the chart before you take the trade.
Fifty real-world Indian market situations. Fifty original annotated charts. Fifty analytical decisions — and one framework that puts risk before direction.

Why this book exists
Every pattern book shows you the shape. None of them shows you the situation.
The same candle at a three-times-tested level and the same candle in the middle of nowhere are different events. A breakout on a quiet Wednesday and a breakout on results day are different events. A gap-down in a calm market and a gap-down with India VIX up 50% are different events. This book teaches you to read the context — the participants, the calendar, the internals — so that a pattern becomes a decision, and “no trade” becomes a decision too.
Situations, not shapes
Expiry-day pinning, Budget Day, lower-circuit stocks, F&O ban breakouts, IPO lock-in expiries, index-rebalance closes — the Indian-market situations no generic TA book covers.
Risk before direction
Every chapter locates the invalidation point first and derives position size from it. Direction is decided last. The recovery table, R-multiples and expectancy are all explained plainly.
Honest about uncertainty
No win-rates, no promises, no tips. Built around SEBI's own studies on why most traders lose — and written to keep you out of those statistics by making you slower, more specific and harder to trap.
What's inside
Eight modules. Fifty situations. One template for every chart.
The Open
Gap-ups into resistance, gap-downs that get bought, the pre-open price that disappears, opening-range fake-outs, exhaustion gaps.
Trend Structure
Failed higher highs, pullbacks to the 20-EMA, bear-market rallies, trend vs range days by 10:30, divergence that refuses to work.
Support, Resistance & Ranges
The third test, role reversal, the 25,000 magnet, volatility compression, springs and upthrusts, support skipped by a gap.
Breakouts, Fake-outs & Volume
3× volume breakouts, bull and bear traps, climaxes, breakouts into an F&O ban, sector-led days, results-day gaps.
Reversals & Traps
Blow-off tops, capitulation with VIX and breadth, dead-cat bounces, triple-tops that break out, patterns that breadth contradicts.
India-Specific Events
Budget Day, RBI at 10:00, Tuesday expiry pinning, election-result gaps, global shocks, MSCI closes, Muhurat, circuit-breaker days.
Stock-Specific Structure
Upper-circuit stocks, serial lower circuits, IPO lock-in expiries, ASM/GSM stocks, bonus/split false gaps, block-deal days.
The Trader, Not the Chart
The perfect setup after three losses, and the chart that says nothing — recognising “no edge” as a complete decision.
The template every situation follows
From the Table of Contents
Ten of the 50 Market Situations
A taste of the book's table of contents. Cards marked 👁 Preview open the actual chart from the book — cards marked 🔒 are worked through inside the full eBook.
Sample pages
Original, annotated charts — drawn to make one idea unmistakable.
All 50 charts are original schematic illustrations (not exchange screenshots), with the clues, confirmation and invalidation marked directly on the chart.
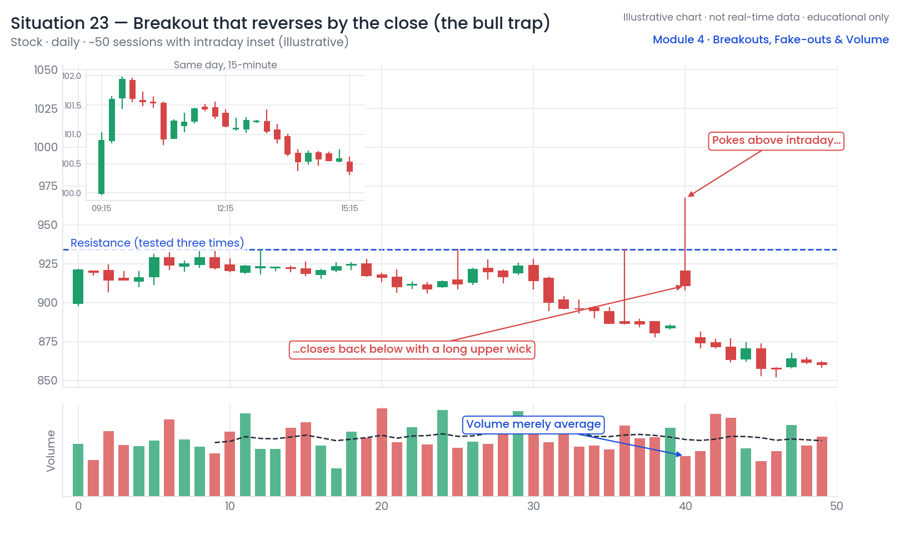
- Market context · clues · confirmation & invalidation · risk plan 🔒 full page inside the eBook
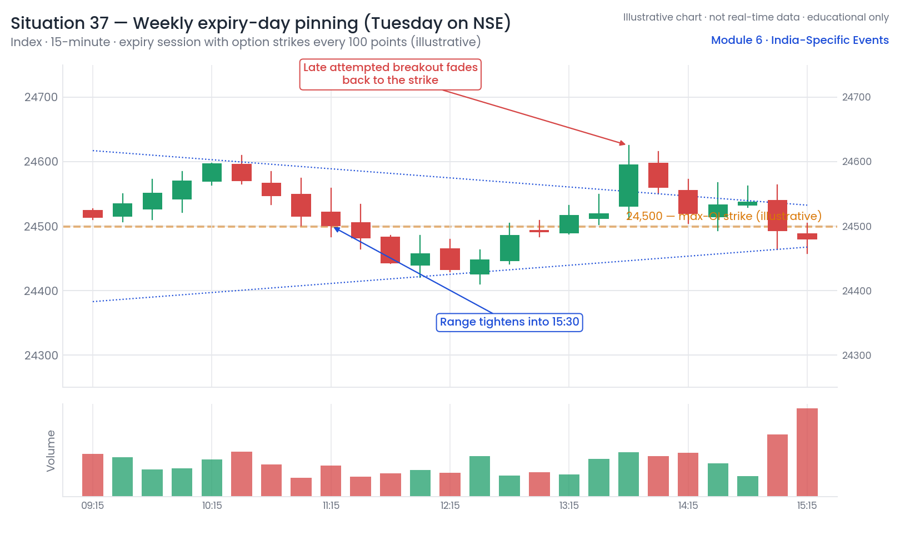
- Market context · clues · confirmation & invalidation · risk plan 🔒 full page inside the eBook
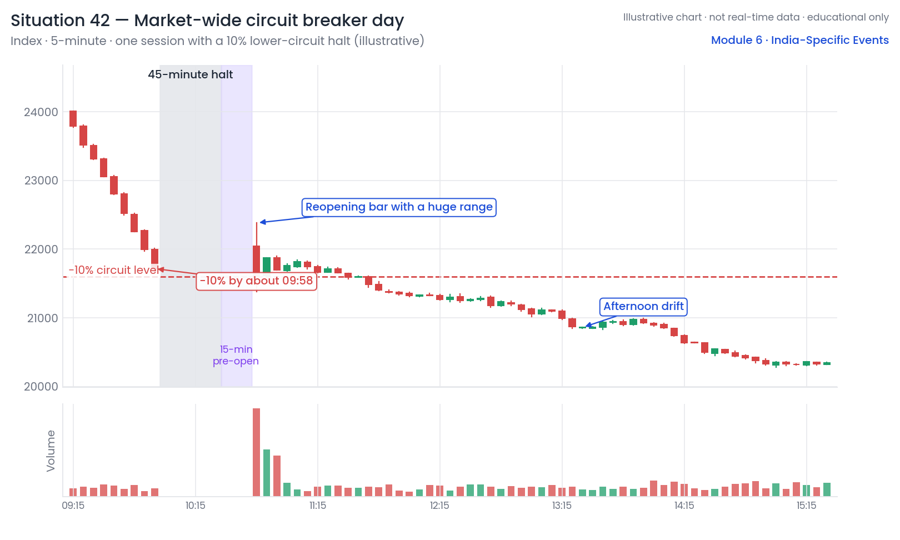
- Market context · clues · confirmation & invalidation · risk plan 🔒 full page inside the eBook
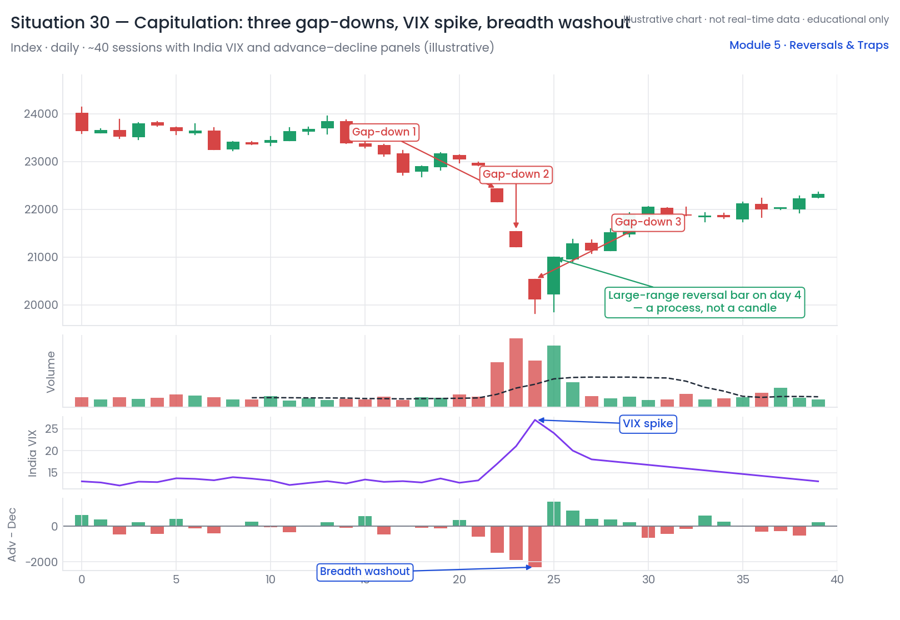
- Market context · clues · confirmation & invalidation · risk plan 🔒 full page inside the eBook
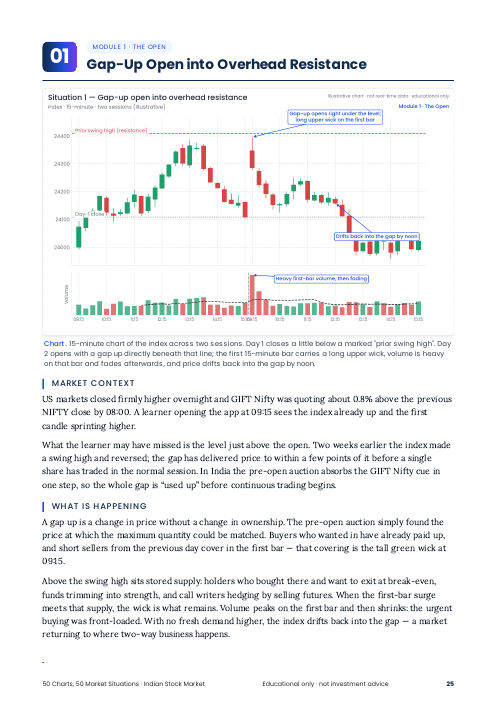
A4 pages, exactly as they appear in the eBook · tap any page to zoom · All charts are original schematic illustrations, not exchange screenshots.
Who it's for
Written for the Indian retail learner who has seen candles — and been surprised by what happened next.
- Beginners who know what a candle is but not what a situation is
- Swing and positional traders who want a repeatable pre-trade checklist
- Intraday traders who keep getting trapped at the open, on expiry or on event days
- Anyone who wants to understand VIX, FII/DII, delivery %, OI and breadth as clues
- Not for anyone looking for stock tips, targets or a “system” with a win-rate
- Not a substitute for advice from a SEBI-registered Investment Adviser
Written by Md Faiyaz Ansari · Published by Ontu Technologies · Not a SEBI-registered intermediary · admin@ontu.in
Launch Offer
Get the complete eBook today.
50 Charts, 50 Market Situations
- 198-page PDF, A4, full colour — read on any device
- 50 situations with original annotated charts
- Part I foundations: sessions, vocabulary, India-specific clues, risk arithmetic
- Printable pre-trade checklist & trading journal template
- 50-situation quick-reference matrix, glossary, 49 cited sources
FAQ
Questions people ask before buying
Is this investment advice or a tips service?
No. It is an educational book about how to read charts and think about market situations. It contains no buy/sell/hold recommendations, no price targets and no forecasts. The author and publisher are not SEBI-registered, and the book is not SEBI-reviewed or approved.
Does it promise profits or a win-rate?
No, and please be wary of anything that does. Technical analysis deals in probabilities and interpretation. The book quotes SEBI's own studies showing that most individual derivatives traders lose money, and its whole purpose is to make you more careful, not more confident.
Are the charts real market screenshots?
No. All 50 charts are original schematic illustrations drawn to demonstrate a concept clearly. Where they echo a historical episode (for example 4 June 2024 or 7 April 2025), it is in stylised form and described in the past tense.
How do I receive the book?
After payment you are redirected to a download page with a button for the PDF. Save it to your device — it is yours to keep. If anything goes wrong, email admin@ontu.in with your payment reference.
Is there a refund?
Because the product is a digital file delivered instantly, refunds are not offered once the download page has been reached. If you are unsure, look at the sample descriptions above first.